Research Question
Using the Food Pattern Modeling process, can healthy eating patterns for vegetarians and for those who want to follow a Mediterranean-style diet be developed? How do these patterns differ from the USDA Food Patterns previously updated for the 2015 DGAs?
Background
Over time, the USDA Food Patterns have represented the types and amounts of foods that will provide sufficient nutrients to meet IOM nutrient recommendations and Dietary Guidelines for Americans recommendations, within calorie needs, for all age/sex groups 2 years of age and older. They are updated every five years during the deliberations of the Dietary Guidelines Advisory Committee, and are presented to the Committee for their assessment of how well the Patterns meet their goals. As part of the update, amounts recommended from each food group may be modified to reach all or most of the specified goals. See the food pattern modeling report Adequacy of the USDA Food Patterns (Appendix E3.1 of the 2015 Dietary Guidelines Advisory Committee Report) for detailed information on the development and evaluation of the overall USDA Food Patterns.
In 2010, vegetarian adaptations of the Patterns were developed at the request of the DGAC and included in the 2010 DGA policy document. These did not modify the underlying structure of the patterns, but rather substituted plant-based foods for animal-based foods at the same overall intake level for each food group.
For 2015 an emphasis of the DGAC has been on identifying evidence-based dietary patterns. The 2010 DGA stated that there is more than one way in which to consume a healthful diet, and the evidence to support this message has expanded with time. In keeping with this growing emphasis in the DGA, the recommended food patterns should illustrate more than one approach to consuming a healthful diet. The dietary patterns reviewed by the 2015 DGAC, including those identified in the NEL Dietary Patterns Systematic Review Project, has indicated evidence for health benefits of following a Mediterranean-style diet (Med-style) and for following a vegetarian diet, in addition to following a Healthy US-style pattern typified by the DASH diet and the USDA Food Patterns (Nutrition Evidence Library, 2014). The 2015 DGAC has explored quantitative information about the food group content of the Med-style and vegetarian patterns, making it feasible, for the first time, to use that information as the basis of food patterns that reflect Vegetarian and Med-style diets.
Plan for Food Pattern Modeling Analysis
Therefore, this modeling analysis will identify Vegetarian and Med-style eating patterns and use them as the basis for 2 new Patterns related to but different from the original USDA Food Patterns (the Healthy US-style Patterns): Healthy Vegetarian Patterns, and Healthy Med-style Patterns. All 3 patterns are considered to be USDA Food Patterns
- Healthy U.S.-style Patterns. The existing USDA Food Patterns are very similar to DASH diets, which have been studied extensively in the U.S. The current USDA Food Patterns will be called “Healthy U.S.-style Patterns” to more clearly identify them. They are similar to evidence-based diets and have been shown to meet almost all nutrient recommendations. They are based on nutrient-dense versions of current consumption patterns in the US, and recommendations for food group intake remain within the broad distribution of current consumption.
- Healthy Vegetarian Patterns. Vegetarian diets have been documented to provide health benefits, but are often described by what is not consumed, and so it has been difficult to identify what actually is consumed. Recent analysis of self-identified (SI) vegetarians in NHANES allows us to build a vegetarian food pattern based on evidence rather than conjecture. These Patterns will build on reported intakes of vegetarians in NHANES rather than on descriptions from research studies considered by the DGAC. As such, these specific intake levels have not been identified as having health benefits. Therefore, adequacy of the Healthy Vegetarian Patterns will be based on meeting the same nutrient standards met by the Healthy US-style Patterns.
- Healthy Med-style Patterns. The diets characterized by research as “Mediterranean” have some similarities to the Healthy US-style Patterns but some notable differences as well. These Patterns will be based on studies that have reported estimates of food group intake from population groups scoring high on Mediterranean-diet (Med-diet) indexes. While nutrient levels will be calculated, determining the adequacy of the Med-style Patterns will primarily be based on similarity to food group intakes of the population groups with positive health outcomes.
Methods
The types of information about food group intakes by vegetarians and those following a Med-style diet differ, so the approaches to creating these patterns will be presented separately.
Healthy Vegetarian Food Patterns
- Review data on food group intakes from analysis of SI vegetarian’s diets, from NHANES 2007-10, to select foods to include/exclude in Vegetarian Patterns (Juan et al., 2014). Select the types of foods to include and exclude based on the most typical choices of SI vegetarians. Identify how the average amounts consumed of each food group or subgroup differ from the non-vegetarians in the NHANES sample.
- Using an iterative process and the information above, determine amounts from each food category that could be included to meet nutrient goals in the Food Patterns at 12 calorie levels. Balance calories by adjusting amounts of oils, solid fats, and added sugars as appropriate.
- Assess nutrient adequacy of the Food Patterns in comparison to Dietary Reference Intakes and 2010 Dietary Guidelines recommendations.
Med-Style Food Patterns
- Review data from Dietary Patterns Composition project on food group intakes for studies assessing diets with a Med-diet index. Compare range of food group intakes to the food group amounts in the Healthy US-Style Food Patterns.
- Select food groups for modification and the range of amounts of each food group to include in initial analysis. Using an iterative process, adjust the amounts to provide smooth transitions across calorie levels Determine the calories and nutrients in the Patterns at 12 calorie levels with varying amounts from each food group. Balance calories by adjusting amounts of oils, solid fats, and added sugars as appropriate.
- Compare nutrients in the Food Patterns to Dietary Reference Intakes and 2010 Dietary Guidelines. Working with the DGAC, determine to what extent nutrient standards for Patterns may be modified for Med-Style patterns.
Results
Development of the Healthy Vegetarian Patterns
Over 90% of SI vegetarians consumed dairy products on the day of the NHANES survey, and 65% of them consumed eggs. Dairy and egg quantities consumed did not differ significantly between SI vegetarians and non-vegetarians. As such, a lacto-ovo vegetarian pattern was modeled. Much smaller percentages reported consuming other animal products, and those who did report consumption ate significantly less than non-vegetarians (Juan et al., 2014) Food group intake of SI vegetarians from NHANES 2007-10, in comparison to non-vegetarians and amounts in the USDA Food Patterns, is shown in Table 1 and Figure 1.
Table 1. Reported food group intake by SI vegetarians and non-vegetarians, from NHANES 2007-10, in comparison to amounts in USDA Food Pattern at 2000 calories. (Juan et al., 2014)
| Food groups and subgroups (unit) | % of SI vegetarians reporting food from group | Amounts reported by SI vegetarians | Amounts reported by Non-vegetarians | Amount in USDA 2000 kcal pattern | |
|---|---|---|---|---|---|
| Meat (oz equiv.) | 27% | 0.67* | 2.57 | 1.8 | |
| Poultry (oz equiv.) | 21% | 0.68* | 1.45 | 1.5 | |
| Seafood (oz equiv.) | 18% | 0.42 | 0.53 | 1.2 | |
| Eggs (oz equiv.) | 65% | 0.41 | 0.47 | 0.4 | |
| Dairy (cup equiv.) | 93% | 1.65 | 1.79 | 3 | |
| Fruits (cup equiv.) | 1.21 | 1.05 | 2 | ||
| Vegetables (cup equiv.) | 1.49 | 1.4 | 2.5 | ||
| Legumes (cup equiv.) | 0.2* | 0.1 | 0.21 | ||
| Soy (oz equiv.) | 0.32* | 0.1 | 0.1 | ||
| Nuts and Seeds | 0.64 | 0.55 | 0.6 | ||
| Grains (oz equiv.) | 7.05 | 6.43 | 6 | ||
| Whole grains (oz equiv.) | 1.23* | 0.7 | 3 | ||
| Solid fats (grams) | 28.9* | 38.13 | 18 | ||
| Added sugars (grams) | 63.2* | 76.9 | 30 | ||
*Significantly different from non-vegetarians p< 0.05
Figure 1. Mean reported intake from Protein Foods subgroups by SI vegetarians in comparison to non-vegetarians (Juan et al., 2014)
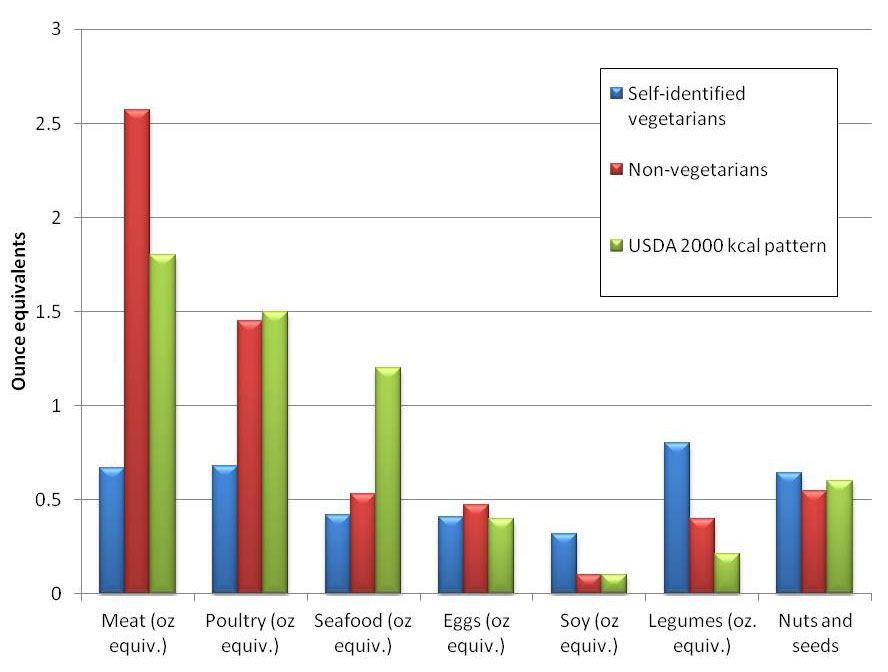
Although SI vegetarians did report consuming some meat, poultry, and seafood, these foods were not included in the Patterns. SI vegetarians consumed significantly more soy products and legumes than non-vegetarians. Amounts of these foods were increased substantially. They also reported slightly more nuts and seeds, and whole and total grains, so amounts in the Patterns were increased to a lesser extent. Amounts of fruits, vegetables, and dairy consumed by SI vegetarians were only slightly different from non-vegetarians, and amounts in the Patterns were already considerably higher than amounts reported by SI vegetarians, and so were not changed.
In the soy foods subgroup, most consumption by non-vegetarians is from processed soy products, such as soy protein isolate, incorporated into a wide variety of manufactured foods. For the Vegetarian Patterns, increased consumption of tofu was used to increase the total amount of soy products in the Patterns, rather than increasing the processed soy component.
Development of the Med-Style Patterns
Quantitative data on food group consumption from studies using a Mediterranean dietary index score was available for 7 cohorts and 2 interventions, almost all in Europe. For use in the Dietary Patterns Composition analysis, consumption data was selected for the groups with a high Med-diet index score and positive health outcomes. These data were converted into grams of food group intake per 1000 calories, to standardize them. For most food groups, the range of intakes was wide. Table 2 presents the range of intakes and the median intake for each food group from the studies that assessed dietary patterns using a Med-diet index. It also shows the amounts in USDA Food Patterns for adults, also converted to grams per 1000 calories, for comparison.
Table 2. Reported food group intake by populations with positive health outcomes, from studies using Med-Diet indexes to assess intake, in comparison to amounts in USDA Food Pattern, in grams per 1000 calories.
| Food groups and subgroups | Range of intakes across studies g/1000 kcal | Median intake in studies g/1000 kcal | Amounts in USDA Food Pattern g/1000 kcal | |||
|---|---|---|---|---|---|---|
| Vegetables (incl. legumes) | 121-195 | 161 | 156-174 | |||
| Fruits | 88-185 | 156 | 96-125 | |||
| Grains/ cereals | 20-135 | 80 | 89-101 | |||
| Red/processed meat | 41-89 | 56 | 25-28 | |||
| Fish and seafood | 22-49 | 32 | 16-20 | |||
| Total dairy | 99-214 | 152 | 194-258 | |||
| Oils | 10-24 | 12 | 13-14 | |||
Amounts of fruit, seafood and red/processed meats are notably higher in the diets with high Med diet scores than in the USDA Patterns. Amounts of dairy are notably lower. While grains are somewhat lower, there is little consistency in what may have been included in this category among the studied diets. Therefore, this food group was not considered for change. Also, the red and processed meat category intakes are notably higher than in the current USDA Patterns, but these were not considered for change. The saturated fat and sodium (in processed meats) in the US make this category inappropriate to increase. However, because of the increase in seafood, the overall amount of Protein Foods was increased in the Med-Style Patterns. In contrast, the total amount of Protein Foods in the Vegetarian Patterns was substantially less than in the other Patterns.
Healthy Vegetarian and Healthy Med-style Patterns
Using the information summarized above, Healthy Vegetarian and Healthy Med-style Patterns were developed at 12 calorie levels. These Patterns, and the Healthy US Style Patterns, reflect three different approaches to consuming a healthy diet. The food group composition of these Patterns at the 2000 calorie level are shown in Table 3. The composition of the Patterns at all calorie levels are provided in additional Tables E3.7.A1 and E3.7.A2.
Table 3. Composition of the Healthy Vegetarian and Healthy Med-style Patterns, and Healthy US Patterns, at the 2000 calorie level. Food group amounts per day, unless noted per week.
| Food Group/subgroup (units) | Healthy US Patterns | Healthy Vegetarian Patterns | Healthy Med-style Patterns |
|---|---|---|---|
| Fruits (cup eq) | 2 | 2 | 2.5 |
| Vegetables (cup eq) | 2.5 | 2.5 | 2.5 |
| Dark Green | 1.5/wk | 1.5/wk | 1.5/wk |
| Red/Orange | 5.5/wk | 5.5/wk | 5.5/wk |
| Starchy | 5/wk | 5/wk | 5/wk |
| Legumes | 1.5/wk | 3/wk* | 1.5/wk |
| Other | 4/wk | 4/wk | 4/wk |
| Grains (oz eq) | 6 | 6.5 | 6 |
| Whole | 3 | 3.5 | 3 |
| Refined | 3 | 3 | 3 |
| Dairy (cup eq) | 3 | 3 | 2 |
| Protein Foods (oz eq) | 5.5 | 3.5 | 6.5 |
| Meats (red and processed) | 12.5/wk | -- | 12.5/wk |
| Poultry | 10.5/wk | -- | 10.5/wk |
| Seafood | 8/wk | -- | 15/wk |
| Eggs | 3/wk | 3/wk | 3/wk |
| Nuts/seeds | 4/wk | 7/wk | 4/wk |
| Processed Soy (incl. tofu) | 0.5/wk | 8/wk | 0.5/wk |
| Oils (grams) | 27 | 27 | 27 |
| Solid fats limit (grams) | 18 | 21 | 17 |
| Added sugars limit (grams) | 30 | 36 | 29 |
*Total amount, includes amount counted toward protein foods.
The nutrient content of these Patterns at the 2000 calorie level is presented in Table 4. Nutrient content of the Patterns at all calorie levels are in additional Tables E3.7.B1 and E3.7.B2. For many nutrients, the amounts in all three Patterns are similar and meet nutritional recommendations. The comparison of the nutrients to goals and limits for each calorie level are in additional Tables E3.7.C1 and E3.7.C2.
Table 4. Selected nutrients in theHealthy Vegetarian, Healthy Med-Style, and Healthy US-Style Patterns, at the 2000 calorie level as a percent of the RDA for a female 19-50 years of age.
| Pattern | Healthy Vegetarian | Healthy Med-style | Healthy US-style |
|---|---|---|---|
| Macronutrients | |||
| Minerals | |||
| Vitamins | |||
| Fatty Acids | |||
| Protein | 71 g | 89 g | 91 g |
| % of RDA | 155% | 194% | 198% |
| % of calories | 14% | 18% | 18% |
| Total lipid (fat) | 75 g | 72 g | 72 g |
| % of calories | 34% | 32% | 33% |
| Carbohydrate | 274 g | 259 g | 256 g |
| % of RDA | 211% | 199% | 197% |
| % of calories | 55% | 52% | 51% |
| Fiber, total dietary | 35 g | 31 g | 31 g |
| % of goal (14 g/1000 kcal) | 126% | 112% | 109% |
| Calcium | 1333 mg | 1001 mg | 1274 mg |
| % of RDA | 133% | 100% | 127% |
| Iron | 17 mg | 17 mg | 17 mg |
| % of RDA | 96% | 95% | 93% |
| Magnesium | 374 mg | 352 mg | 352 mg |
| % of RDA | 121% | 113% | 114% |
| Potassium | 3311 mg | 3353 mg | 3348 mg |
| % of AI | 70% | 71% | 71% |
| Sodium | 1405 mg | 1685 mg | 1787 mg |
| % of UL | 61% | 73% | 78% |
| Vitamin A (in µg RAE)* | 869 µg | 815 µg | 898 µg |
| % of RDA | 124% | 116% | 128% |
| Vitamin E (in mg AT) | 10.8 mg | 10.5 mg | 10.2 mg |
| % of RDA | 72% | 70% | 68% |
| Vitamin C | 116 mg | 134 mg | 117 mg |
| % of RDA | 155% | 178% | 155% |
| Vitamin D (in IU) | 223 IU | 251 IU | 274 IU |
| % of RDA | 37% | 42% | 46% |
| Folate (in µg DFE) | 667 µg | 592 µg | 586 µg |
| % of RDA | 167% | 148% | 146% |
| Choline | 283 mg | 345 mg | 349 mg |
| % of AI | 66% | 81% | 82% |
| Saturated fatty acids | 18.6 g | 18.0 g | 18.7 g |
| % of calories | 8% | 8% | 8% |
*Includes vitamin A precursors
Note: Results for all nutrients at all calorie levels are provided in additional Tables E3.7.B1, E3.7.B2, E3.7.C1, and E3.7.C2.
In the Healthy Vegetarian Pattern at 2000 calories, amounts of protein, vitamin D, sodium, cholesterol, and choline are lower than the Healthy US Pattern, while fiber and folate are higher, mainly due to the increased amount of legumes. Calcium is also somewhat higher in the Vegetarian Pattern. This is because in addition to the calcium from dairy and other food groups, the nutrient profile for processed soy products reflects an increased amount of tofu, which is often precipitated with a calcium salt. The increased amounts of calcium are not large, however. The calcium level in Healthy Vegetarian Patterns for adolescent girls is from 96% to 100% of the RDA, and for women over 50, 104% of the RDA. If Dairy intake had been lowered in the Vegetarian Patterns, the calcium levels would be below RDA standards.
In the Med-Style Pattern at 2000 calories, amounts of calcium are lower, and vitamin A, vitamin D, and sodium are somewhat lower than the Healthy US Style Patterns. This reflects the lower amount of Dairy in the Med-Style Pattern. Vitamin C is higher, reflecting the higher amount of fruit in the Pattern. Cholesterol is also somewhat higher, due to the higher amount of seafood in the Patterns.
Note that the Med-Style Pattern at 2000 calories does meet the calcium RDA for a woman 19 to 50, but it would not meet the higher RDA for an adolescent 9 to 18 or an adult over the age of 50, whose RDA is higher. For adolescents, the amount of calcium in the Med-Style Patterns, depending on the specific calorie level required, ranges from 71% to 82% of their RDA, and for adults over the age of 50, calcium levels range from 77% to 83% of their RDA. (See additional Tables E3.7.B2 and E3.7.C2 for all results.) The USDA Food Patterns have traditionally used meeting RDA and other nutrition goals as their standard; the Med-Style Patterns do not fully meet the RDAs. However, these diets have been shown to have health benefits, and the entire dietary pattern may modify requirements for specific nutrients.
Summary
The 2015 DGAC placed an emphasis on identifying and describing evidence-based healthful dietary patterns, and identified evidence for health benefits of following a Med-style diet and a vegetarian diet, in addition to following a Healthy US-style pattern typified by the DASH diet and the 2010 USDA Food Patterns. The 2015 DGAC also explored quantitative information about the food group content of the Med-style and vegetarian patterns, making it feasible, for the first time, to use that information as the basis of USDA Food Patterns that reflect Vegetarian and Med-style diets.
The 2010 DGA stated that there is more than one way in which to consume a healthful diet, and the evidence to support this message has expanded with time. In keeping with this growing emphasis, the USDA Food Patterns have been modified to illustrate more than one approach to consuming a healthful diet. Based on the work of the 2015 DGAC, the USDA Food Patterns have been expanded to include three different approaches to consuming a healthful diet: Healthy US-Style Patterns, Healthy Vegetarian Patterns, and Healthy Med-Style Patterns. In comparison to the Healthy US-Style Patterns, the Healthy Vegetarian Patterns include more legumes, processed soy products, nuts and seeds, and whole grains. They contain no meat, poultry, or seafood, and are identical to the Healthy US-Style Patterns (the original USDA Food Patterns) in amounts of all other food groups. The Healthy Med-Style Patterns contain more fruit and seafood and less dairy than the Healthy US-Style Patterns.
All of the Patterns meet nutritional goals for almost all nutrients with some notable exceptions. With a few exceptions, the nutrient goals not met are the same as for the original USDA Food Patterns. Levels of calcium are highest in the Vegetarian Patterns, because in addition to Dairy they contain larger amounts of tofu, which is often precipitated with a calcium salt, although amounts of calcium vary widely across tofu types. Levels of calcium are lowest in the Healthy Med-Style Patterns, because the amounts of Dairy in those patterns have been decreased.
References:
Juan, WY, Yamini, S, Britten, P. Food Intake Patterns of Self-Identified Vegetarians among the U.S. Population, 2007-2010. Presentation at National Nutrient Databank meeting, May 14-17, 2014, Portland OR.
Institute of Medicine. Dietary reference intakes for calcium, phosphorus, magnesium, vitamin d, and fluoride. Washington DC: National Academies Press, 1997.
Nutrition Evidence Library. A series of systematic reviews on the relationship between dietary patterns and health outcomes. Alexandria, VA: U.S. Department of Agriculture, Center for Nutrition Policy and Promotion, March 2014. Available at [URL]
Additional Tables available through Appendix E-3:
E3.7.A1 Food group amounts in USDA Healthy Vegetarian Patterns at all Calorie levels
E3.7.A2 Food group amounts in USDA Healthy Mediterranean-style Patterns at all Calorie levels
E3.7.B1 Nutrients in USDA Healthy Vegetarian Patterns at all Calorie levels
E3.7.B2 Nutrients in USDA Healthy Mediterranean-style Patterns at all Calorie levels
E3.7.C1 Comparison of nutrient content of each USDA Healthy Vegetarian Pattern to the nutritional goals for that pattern
E3.7.C2 Comparison of nutrient content of each USDA Healthy Mediterranean-Style Pattern to the nutritional goals for that pattern